


Disaster Data Retrospective: When Warning Systems Failed - Texas flood, Maui wildfire and Missouri tornado
A data-driven investigation into the recent Texas flash flood in July, Maui wildfire in 2023, and the Missouri tornado in 2011 using ChatGPT, Python, and Power BI

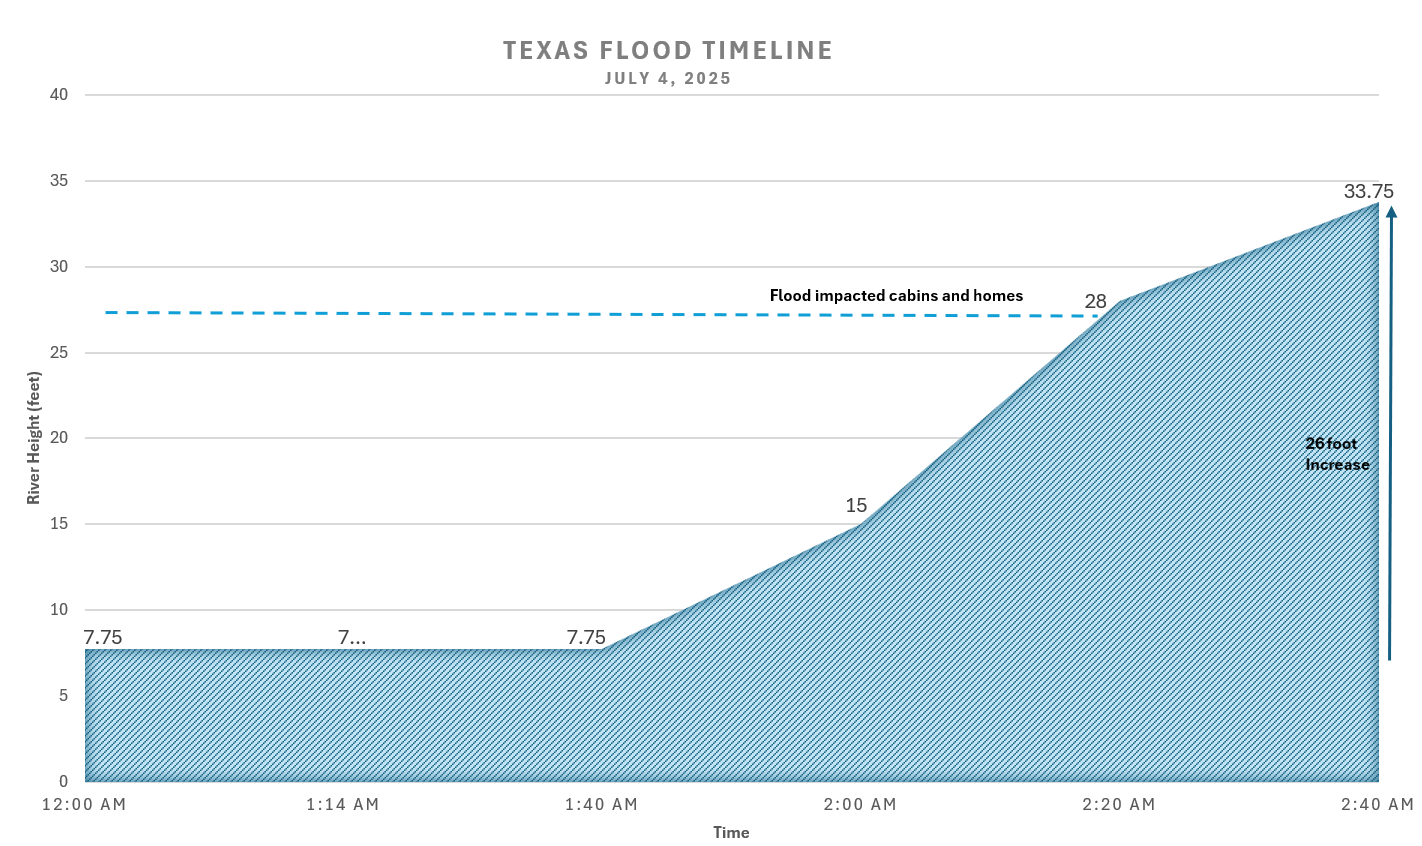
Texas Flood Timeline:
Normal river height ~ 7.75 feet (1:40 a.m., confirmed)
Cabins and homes breached at 28 feet (2:20 a.m., estimated)
River crest reached 37.5 feet, nearly 5x normal river height (5:10 a.m., confirmed)
1. Introduction: Real Events, Real Failures
Texas Flash Flood – July 4, 2025 (Kerr County)
Over 18 inches of rain poured within 3 hours on July 3–4.
River levels surged 26 ft in 45 minutes, cresting at 37.5 ft at 5:10 a.m. early July 4.
Flash Flood Emergency issued at 1:14 a.m., yet evacuation didn’t begin until after 2:00 a.m.
No outdoor sirens were activated. At least 130 deaths, including 27 children, occurred when cabins flooded; campers were asleep with no audible alert.
(Source: The Guardian, WSJ)
Maui Wildfire – August 8, 2023 (Lāhainā, Maui)
Wind-driven wildfires devastated Lāhainā, killing 102 people and destroying over 2,200 structures.
Despite an 80-siren network, none were activated, allegedly to avoid confusion with tsunami signals. Cell alerts were inconsistent amid power and network outages.
(Sources: Politico, AP News)
Joplin Tornado – May 22, 2011 (Joplin, Missouri)
An EF5 tornado (~200–250 mph) struck between 5:34–6:12 p.m. CDT, destroying 4,000+ homes, causing 158 direct deaths and 1,150+ injuries.
Sirens sounded 20 minutes prior, but many residents didn't take shelter due to “warning fatigue”—frequent alerts that reduced trust.
(Sources: NWS report)
2. What These Disasters Have in Common
Missed timing: Alerts either arrived late or not at all—campers in Texas, Maui residents in power outages, and sleeping adults in Lāhainā.
Single-channel alerts failed: With no sirens or reliance solely on mobile, critical warnings didn’t cut through.
Trust erosion: Missouri’s frequent false alarms created complacency, weakening compliance when it mattered.
3. Diagnosing Failures with Data Tools
By using Python + Power BI, we can pinpoint exactly where these systems failed:
Use Case: Texas Flood
Compare sensor timestamps (river gauge spike at 12:20 a.m.) to alert dispatch time (1:14 a.m.).
Visualize delay vs. crest timing to show evacuation window missed.
Use Case: Maui Wildfire
Map sirens‑not‑activated vs. actual fire spread times.
Overlay cell alert logs with power grid failure data to locate where warnings never reached.
Use Case: Missouri Tornado
Chart alert frequency vs. actual tornado occurrences.
Measure siren reach (some residents didn’t hear sirens) using coverage heatmaps and survey data.
4. Sample Code & Dashboard Concept
python

import pandas as pd

# Example structure for comparing warning lags
df = pd.DataFrame({
    'event': ['TexasGauge', 'TexasAlert', 'MauiSiren', 'MissouriSiren'],
    'time': [...],  # datetime of each
})
# Calculate lag between hazard detection and alert sent
df['lag'] = df.groupby('event_type')['time'].diff().dt.total_seconds() / 60
Power BI Dashboard:
Timeline chart showing gauge spikes, alert release, siren activation.
Heatmap layers: mobile coverage, siren array zones, and alert reception rates.
Use-case filter: toggle between Texas, Maui, and Missouri to highlight each scenario.
Alerts didn’t reach people in Texas, Maui, or Missouri —data shows exactly when and why
5. Why This Matters to You
For data professionals and tech leaders, this isn’t theoretical—it’s actionable. Each use case demonstrates:
Texas: diagnostics for system latency and missing infrastructure.
Maui: visibility into alternative alert robustness when networks fail.
Missouri: modeling for trust erosion and signal fatigue over time.
This post highlights where warning systems fell short in Texas (flood), Maui (fire), and Missouri (tornado).
By mapping sensor data, sirens, and alerts in Python/Power BI, we can spot breakdowns and prepare responsive systems.
In upcoming posts, we'll show exactly how to convert these diagnostics into solutions using AI-generated alerts, sensor forecasting, multi-channel deployment, and a unified Threat Matrix—visible from one dashboard for decision-makers.
🛠️ Next: Deploy AI alerts, multi-channel notifications, and unified dashboards to turn diagnosis into lifesaving action.