
Most Dashboards Fail the 10-Second Test
Most dashboards don't fail because the software is weak.

In Power BI, it’s easy to build something that looks impressive. Add a few KPI cards. Drop in a bar chart. Add a slicer. Maybe a trend line. Before long, the page looks busy enough to feel complete.
But busy isn’t useful.
A useful dashboard guides the user. It says: start here. Notice this. Compare those two things. Drill in if something looks wrong. Make this decision.
That’s the focus of Chapter 4 of *Smart Dashboards with Power BI, ChatGPT, and Copilot*: visual storytelling. Not visual decoration. Not dashboard wallpaper. Storytelling is crucial. Arrange the information so the user can see what’s happening and decide what to do next.
This is also where the AI tools earn their keep, but only if you use each one for the right job.
Copilot builds faster inside Power BI.
ChatGPT helps you think through structure, hierarchy, and audience.
Power BI is where the dashboard gets tested, refined, and delivered.
The 10-Second Test
Here’s the test I keep coming back to:
**Can the user understand the main message in 10 seconds?**
If not, the dashboard is making them work too hard.
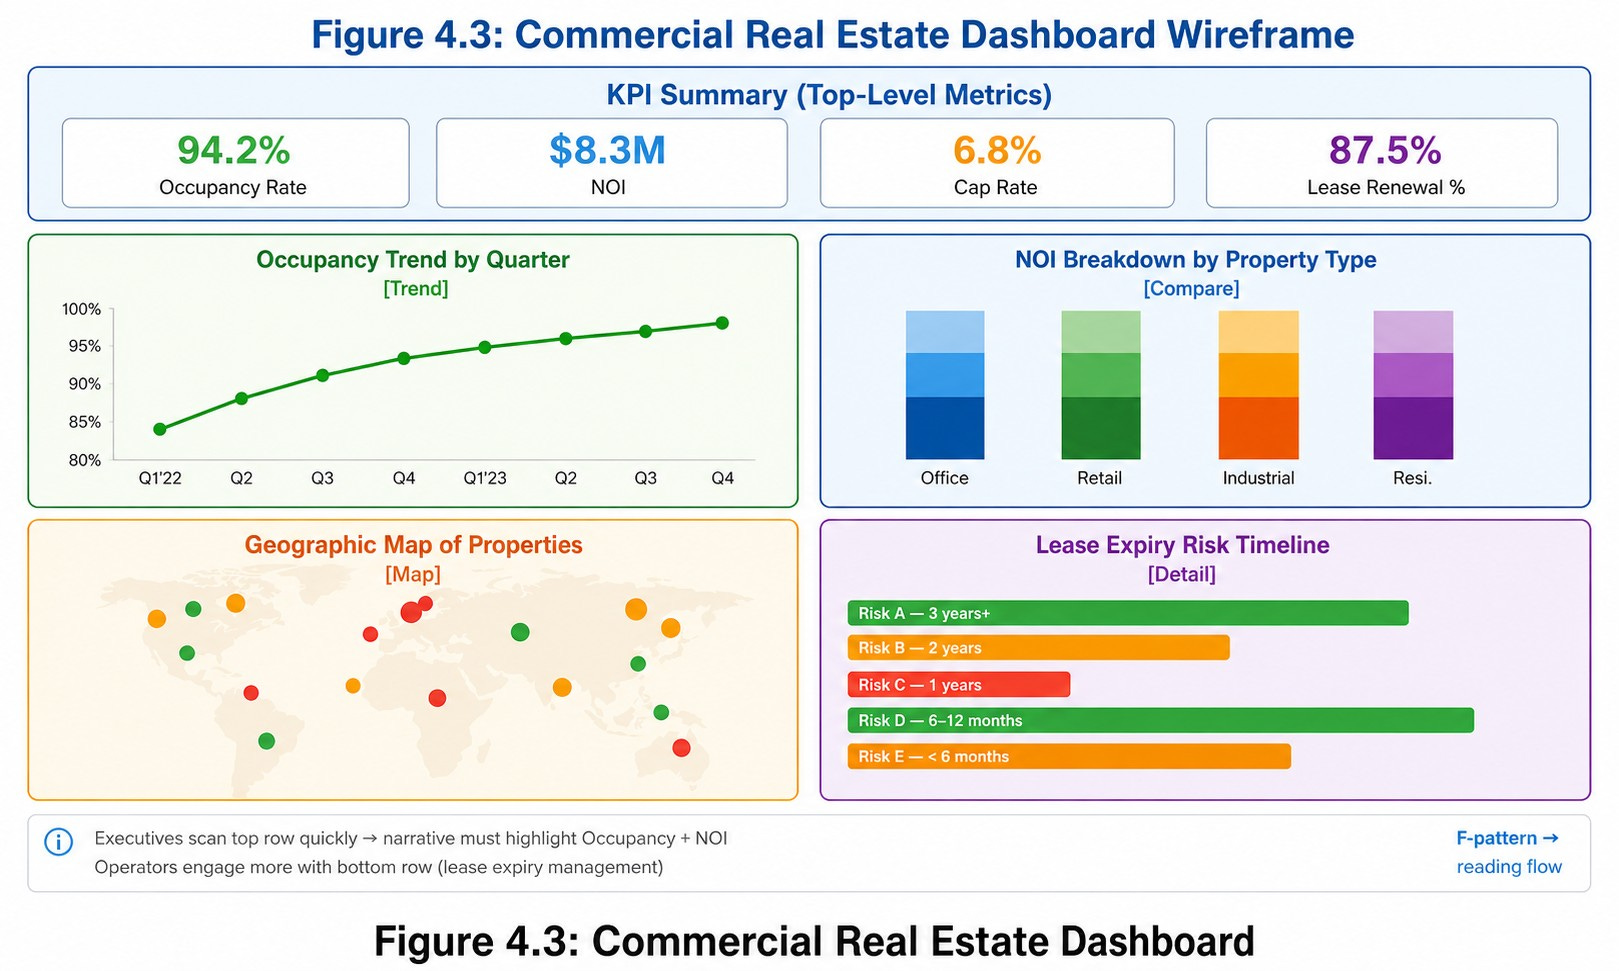
Take a commercial real estate example. The audience is property managers and executives who need to know whether the portfolio is healthy, weakening, or in trouble. They don’t need every metric on the main page. They need the four that answer the question:
- Occupancy Rate
- Net Operating Income
- Capitalization Rate
- Lease Renewal Percentage
That’s already a major design decision. The dataset probably also includes utility costs, maintenance tickets, rent rolls, vacancy history, tenant detail, broker notes, and dozens of other fields. All of that has a place but just not on the first screen.
A dashboard is not supposed to make users hunt for meaning. It should reduce the hunt.
Where ChatGPT Comes In Before You Touch Power BI
Before you start formatting anything, ChatGPT can help you decide what belongs where.
A useful prompt:
*I am designing a Power BI dashboard for commercial real estate executives. The dataset includes occupancy rate, net operating income, cap rate, lease renewal percentage, maintenance costs, tenant type, lease expiration date, property location, and property manager. Which metrics should appear on the first screen, and which should move to a drill-through or detail page?*
You’re not asking ChatGPT to “make a dashboard.” You’re asking it to help you prioritize. That’s a much better use of AI.
Copilot Builds the Draft. ChatGPT Improves the Story.
Once the metric hierarchy is clear, Copilot becomes useful inside Power BI:
*Create a dashboard page showing occupancy rate, net operating income, cap rate, and lease renewal percentage as KPI cards. Add a trend visual for NOI over time and a bar chart comparing occupancy by property.*
That gives you a starting point. But a starting point isn’t a finished dashboard.
This is where ChatGPT comes back in. Describe the layout or paste a screenshot and ask:
*Review this dashboard for an executive audience. What should be moved, removed, renamed, or emphasized so the user can understand portfolio health in under 10 seconds?*
The answer might recommend moving the four KPI cards to the top row, clearer labels, a subtitle explaining the time period, conditional formatting for risk, and a separate section for lease expiry. That’s feedback you can actually act on.
The loop is:
1. ChatGPT defines the audience and decision.
2. ChatGPT simplifies the metric list.
3. Copilot creates the first draft.
4. ChatGPT critiques the layout.
5. Copilot implements the refinements.
6. You validate in Power BI.
Think. Build. Review. Refine. Validate.
The Junk Drawer Problem
The fastest way to weaken a dashboard is to add every metric that someone requests.
The executive wants revenue. Finance wants operating income. Operations wants maintenance costs. Property managers want lease expirations. Asset managers want cap rates. Everyone wants “just one more number.”
Soon the dashboard becomes a junk drawer. Nothing is technically wrong, but the page no longer has a point.
Metric selection is a design decision. Gross revenue, net revenue, operating income, and EBITDA may all be useful but they may not all belong in the same top row. If they tell overlapping stories, you’ve made the dashboard harder to read, not more informative.
ChatGPT works well as a clarity filter here:
*Review this dashboard metric list and identify redundancies. Which metrics should stay on the executive summary page, which should move to a detail page, and which could be removed?*
Not a chart generator. A clarity filter.
One Dataset, Different Decisions
Same data, different audiences:
An executive wants the portfolio summary.
A property manager wants lease expirations and vacancy risk.
A finance team wants NOI trends and budget variance.
A leasing team wants renewals and expiring contracts.
One dataset. Different decisions. Different dashboards.
This is where I’ve seen teams overbuild. They try to cram every audience into a single page and end up serving none of them well. Better to build three focused dashboards than one overloaded one.
ChatGPT can help here too:
*Using the same commercial real estate dataset, recommend three dashboard versions: one for executives, one for property managers, and one for finance. For each, list the top KPIs, supporting visuals, and the main decision the dashboard should support.*
The Bigger Lesson
The future of dashboard design isn’t just faster report creation. It’s better decision design.
Power BI gives you the canvas. Copilot helps build the first version faster. ChatGPT helps sharpen the story, simplify the layout, and adapt the dashboard to the audience.
But the analyst still owns the judgment. That’s the point. AI helps you move faster, but it should also help you think better.
A dashboard is not a place to show everything you know.
It’s a place to show the user what matters next.
*Chapter 4 of [Smart Dashboards with Power BI, ChatGPT, and Copilot] walks through the full workflow with worked examples, prompts, and screenshots, including the commercial real estate dashboard end-to-end.